Can You Trust 2020 Social Media Metrics for 2021’s Influencer Campaigns?
By Meredith Bodgas and Brandon Perlman
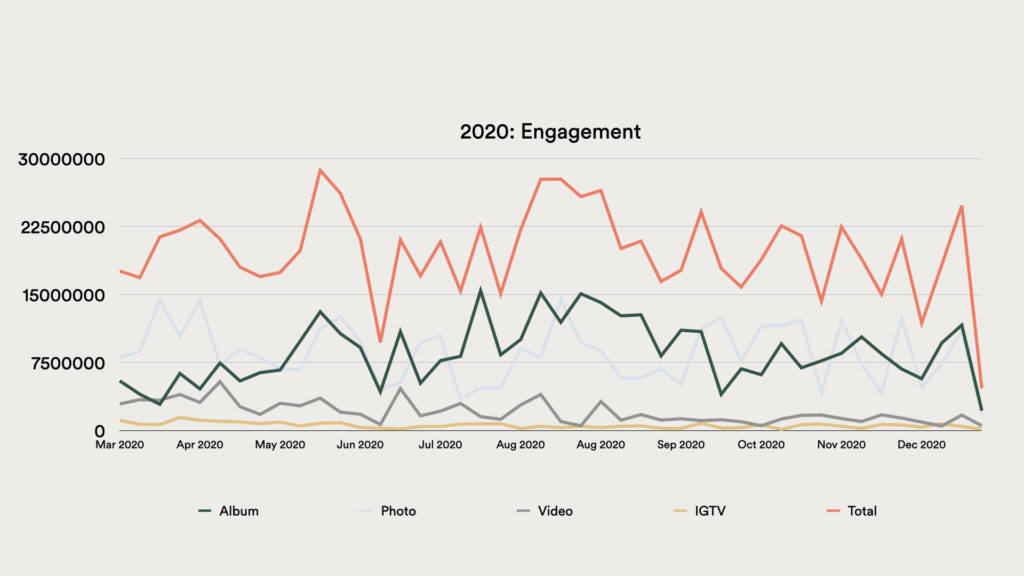
Typically, businesses make their social media plans for the year ahead based on how their efforts fared on the platforms in the trailing 12 months. But—understatement alert—there was nothing typical about 2020. Social media engagement increased during the pandemic by 61% and American adults spent about 7 more minutes per day on social media than in 2019, thanks to this trifecta: the first (and we hope the last) pandemic of the information age, the first set of worldwide civil rights protests, and a more-contentious-than-ever US presidential election. While these aren’t exactly standard influencer fodder, Instagram influencers saw their average likes increase by about 68%, and their comments were up by 50% too. And views of certain kinds of content, such as cooking and fitness, doubled during the COVID crisis. But can brands count on continued increased social engagement in 2021, and should they plan their marketing budgets accordingly? We took a look at social engagement (with a focus on Instagram)—for brands and influencers—in beauty, food, fashion and travel in 2020 to track trends and make predictions for 2021.
The Takeaways
The wackiness of 2020 led to wacky metrics that just aren’t what we expected pre-pandemic—or even looking back now that 2020’s wrapping up.
- People’s increased social media use didn’t lead to roaring success for most brands.
- All four industries saw drops in engagement rates—only fashion influencers saw more engagement in 2020 than in 2019.
- Those drops in engagement were more significant with brands than with influencers.
But there are important reasons for those:
- Extraordinary world events won consumers’ attention on Instagram.
- People relate better to other people—aka influencers—than brands, even when (or maybe because!) they weren’t seeing many folks IRL.
But what about those fashion influencers? How did they get stiletto-high engagement while everyone else slumped? The list we looked at included the rich and fabulous, such as Heidi Klum, Tyra Banks, and Gisele Bundchen. Followers (and haters, for that matter) just had to check in on how these perfect people were faring—and what they were wearing—when they too were mostly confined to their homes. Plus, 2020 put all consumers on the same clothing page. Fashion influencers had to pivot from street style to couch style pretty quickly. Audiences were looking for what was acceptable wfh wear, and with no dress code for a pandemic, people took to Instagram and influencers for validation that yes, leggings do in fact count as pants, and when you did venture out, there was a chic way to wear a mask.
BEAUTY
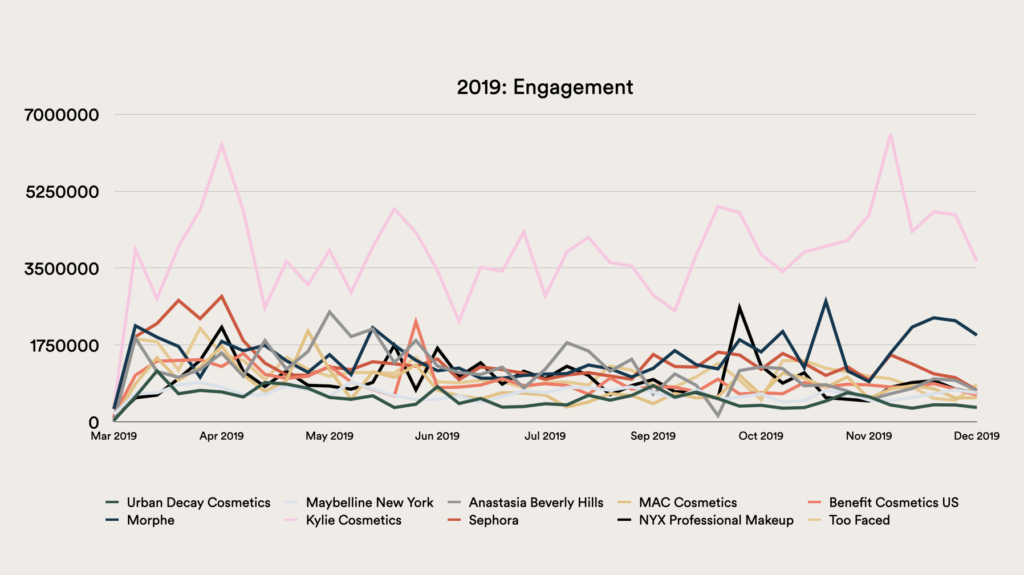
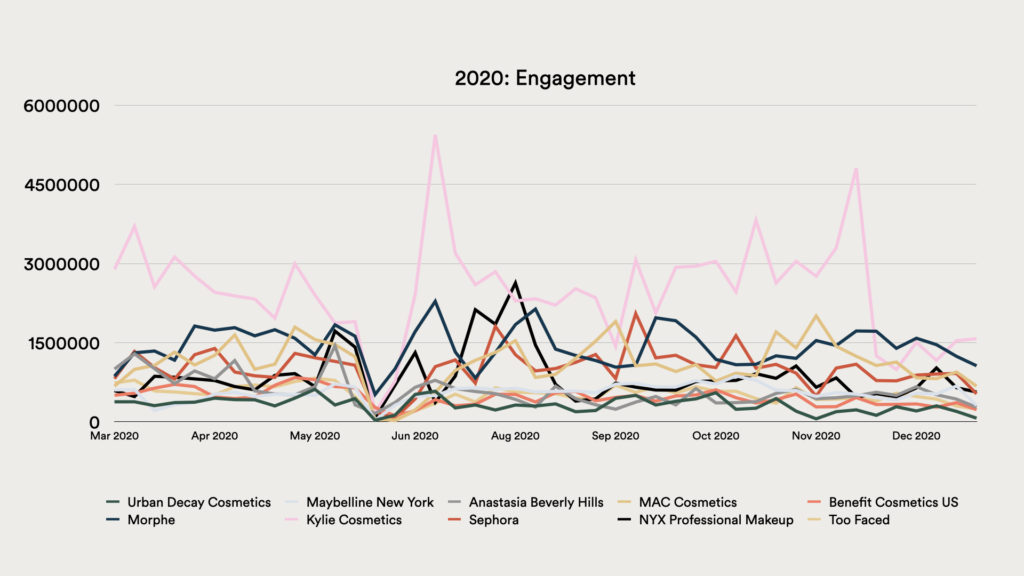
Top 10 Beauty Brands on Instagram:
Engagement, 3/16/19 – 12/20/19 vs 3/16/20 – 12/20/20
Weekly engagement rate: .40% vs 26%, a 35% drop.
Average weekly post count: 22 vs. 23
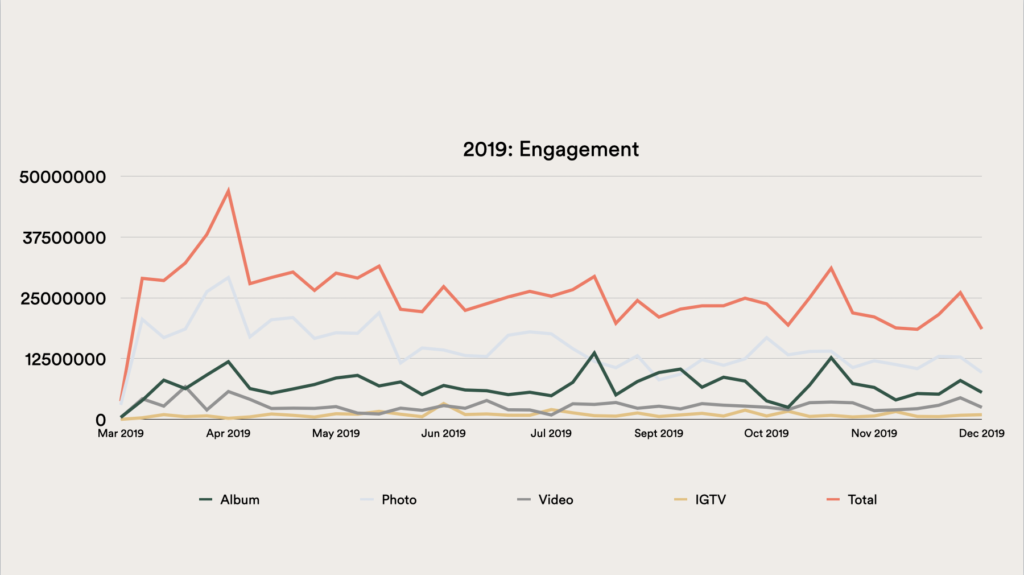
A Social Studies list of 185 Beauty Influencers on Instagram
Engagement, 3/16/19 – 12/20/19 vs. 3/16/20 – 12/20/20
Weekly engagement rate: 2.74% vs. 2.33%, a 15% drop.
Average weekly post count: 725 vs. 577
FOOD
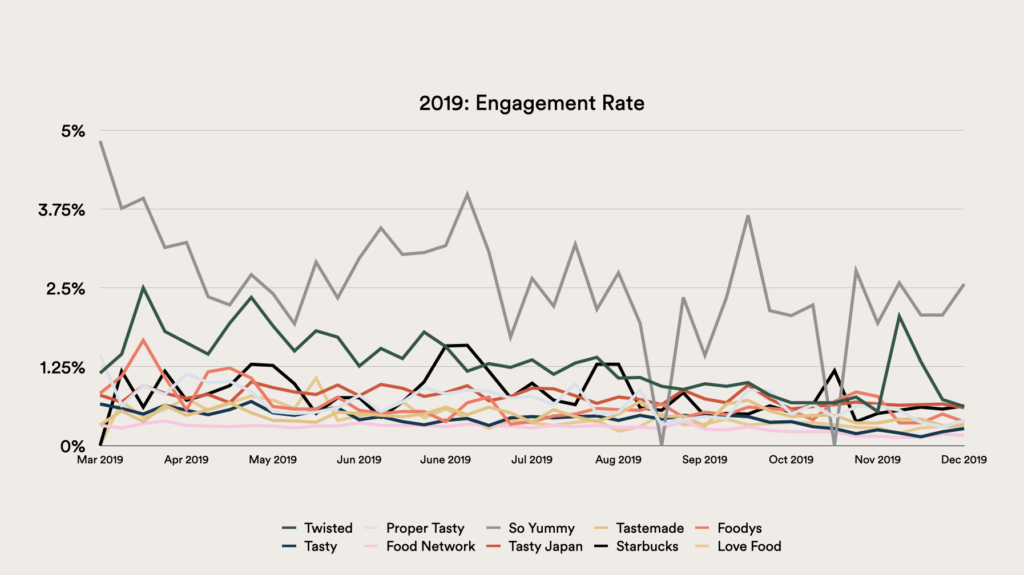
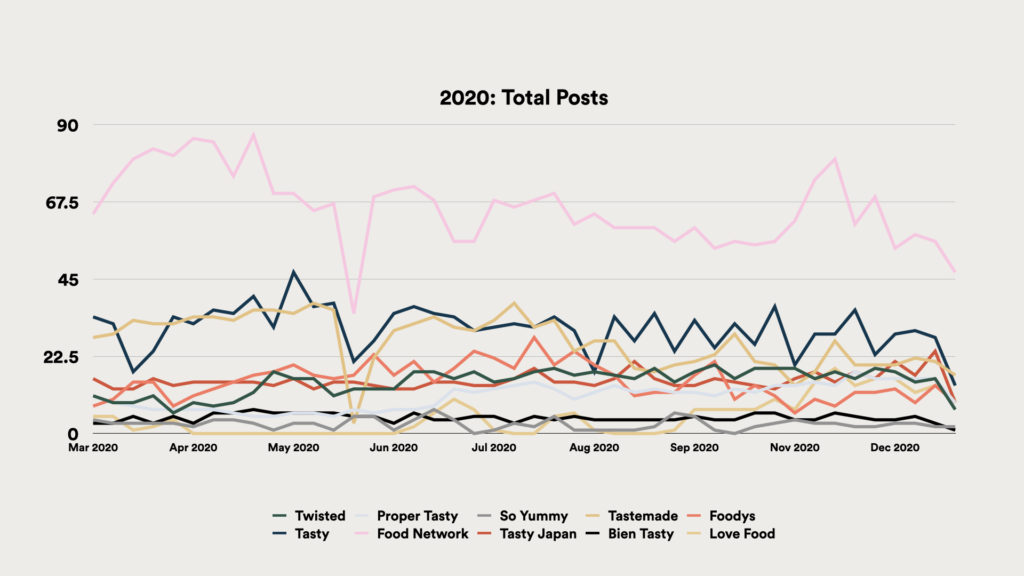
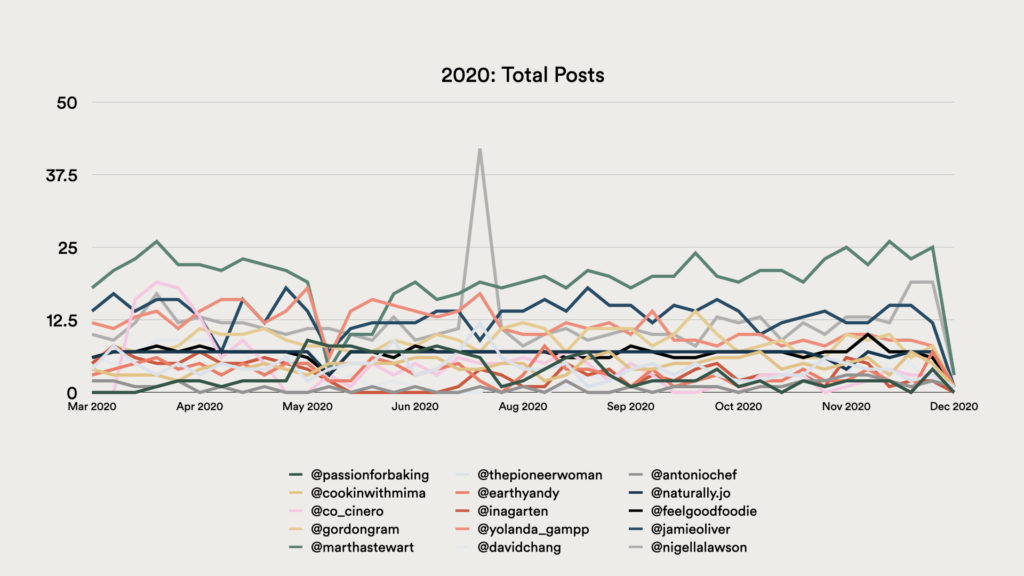
10 of the most followed food brands
Engagement, 3/16/19 – 12/20/19 vs. 3/16/20 – 12/20/20
Weekly engagement rate: .85% vs. .38%, a 55% drop.
Average weekly post count: 16 vs. 19
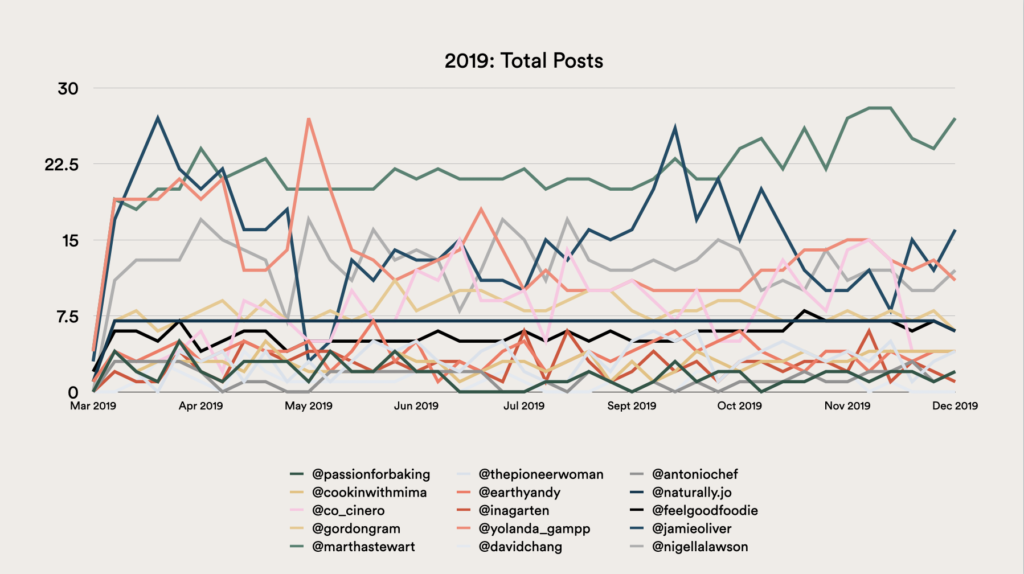
15 of the most followed food influencers
Engagement, 3/16/19 – 12/20/19 vs. 3/16/20 – 12/20/20
Weekly engagement rate: 1.69% vs. 1.47%, a 13% drop.
Average weekly post count: 7 vs. 7
FASHION
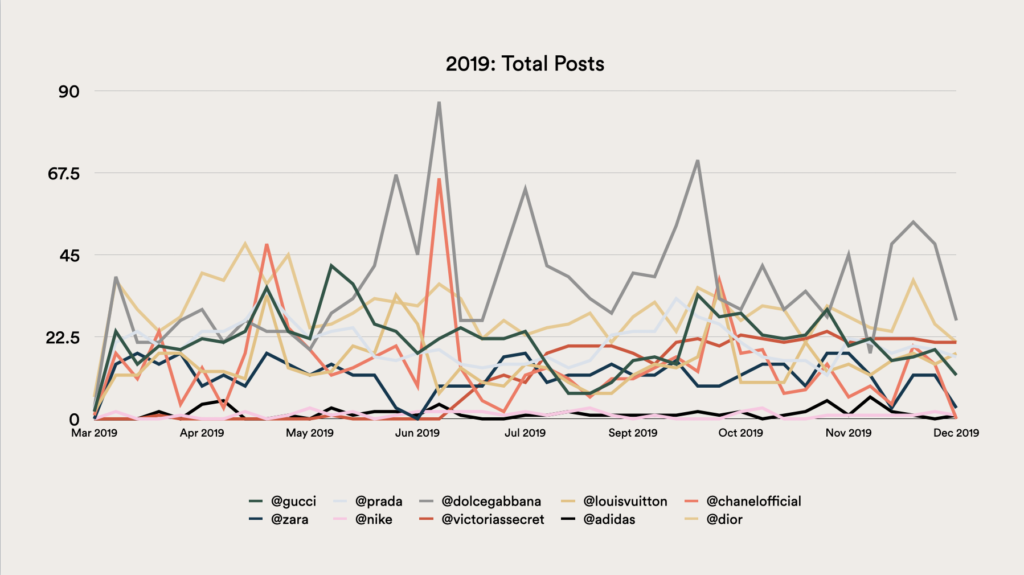
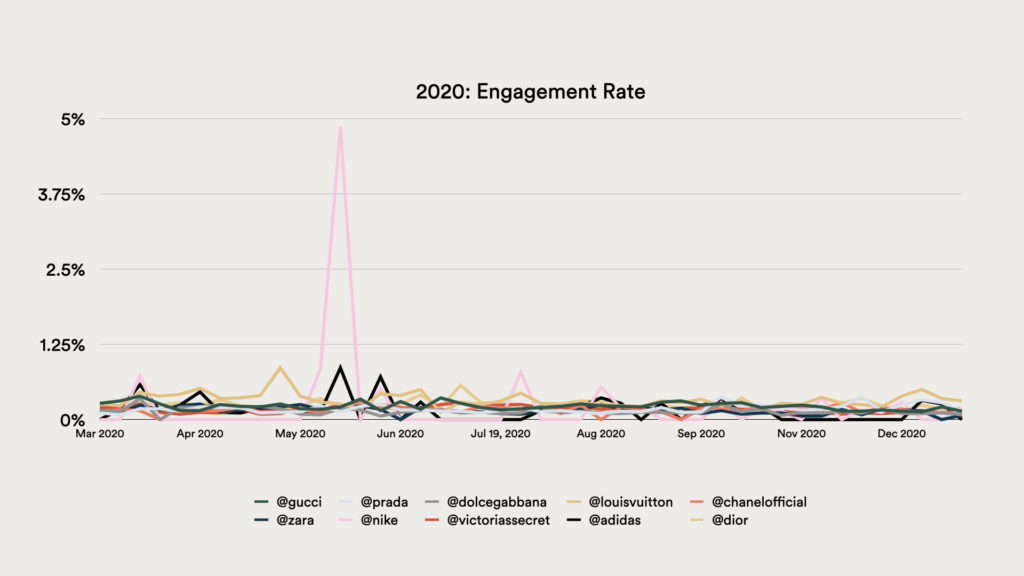
10 of the most followed fashion accounts on Instagram
Engagement, 3/16/19 – 12/20/19 vs. 3/16/20 – 12/20/20
Weekly interaction rate: .27% vs. .25%, a 7% drop.
Average weekly post count: 16 vs. 12
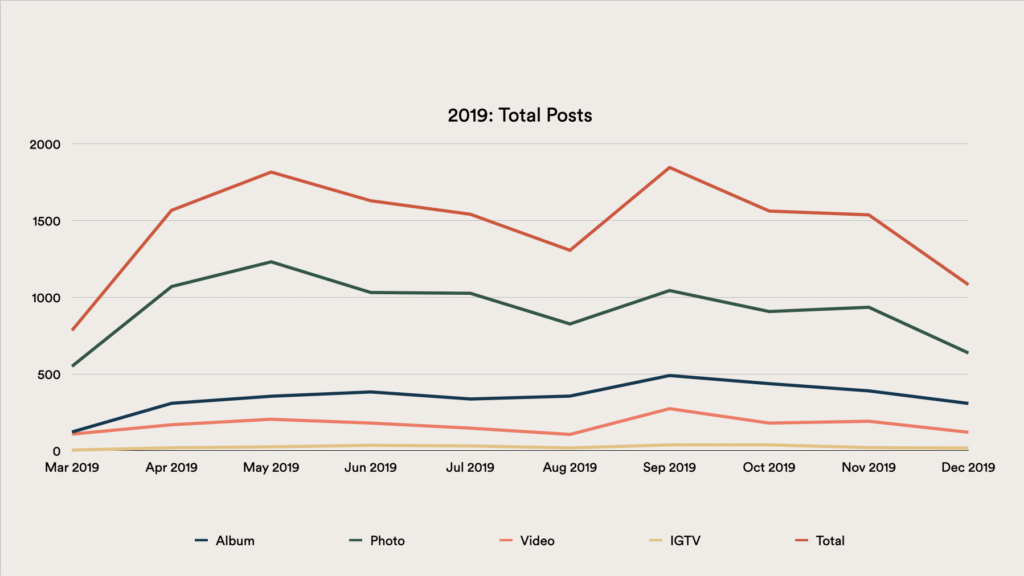
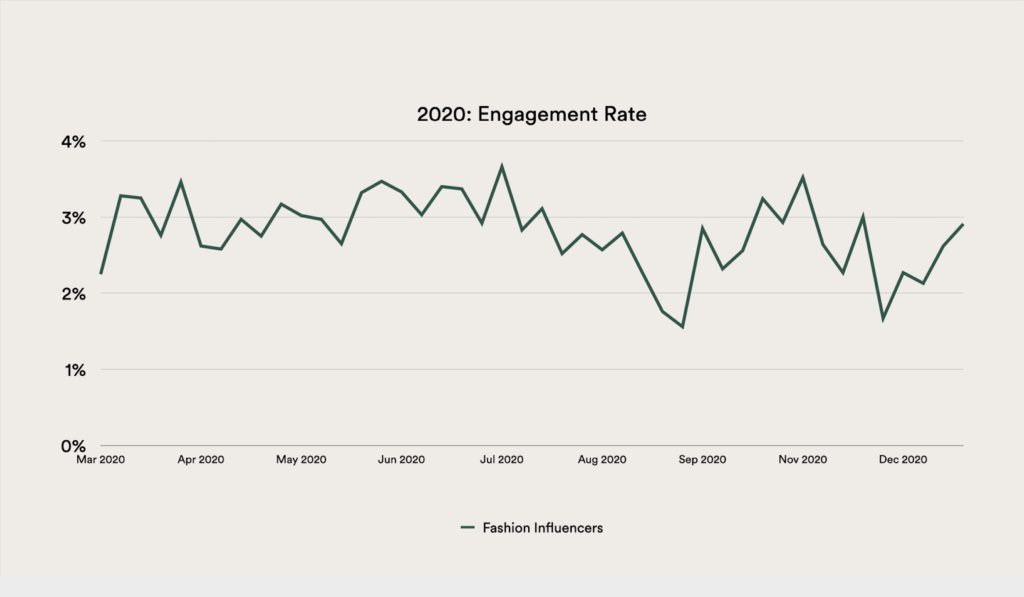
Public CrowdTangle list of 65 fashion influencers on Instagram
Engagement, 3/16/19 – 12/20/19 vs. 3/16/20 – 12/20/20
Weekly engagement rate: 2.46% vs. 2.80%, a 14% rise.
Average weekly post count: 358 vs. 281
TRAVEL
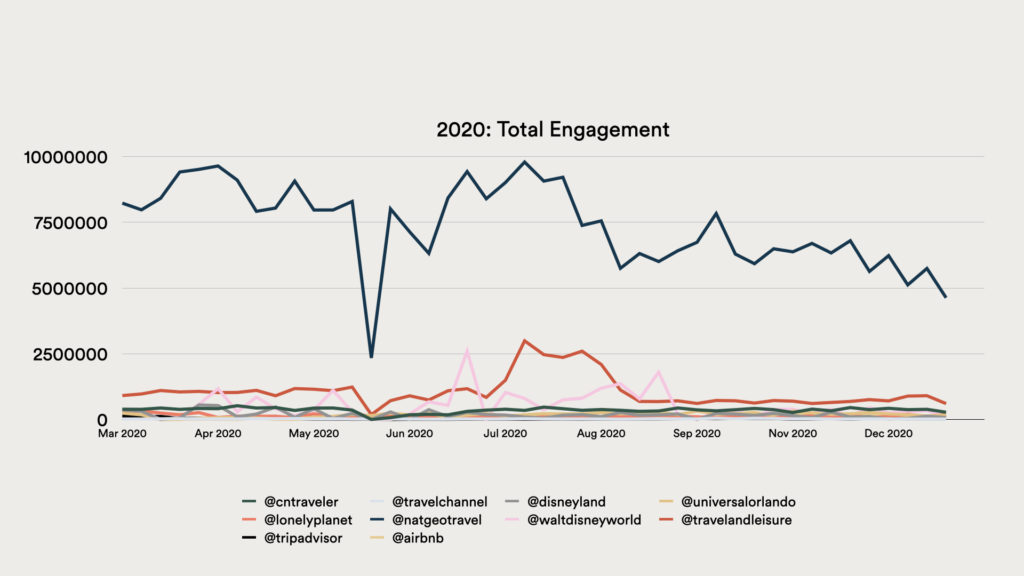
Top 10 travel accounts on Instagram
Engagement, 3/16/19 – 12/20/19 vs. 3/16/20 – 12/20/20
Weekly engagement rate: .89% vs. .77%, a 14% drop.
Average weekly post count: 14 vs. 12
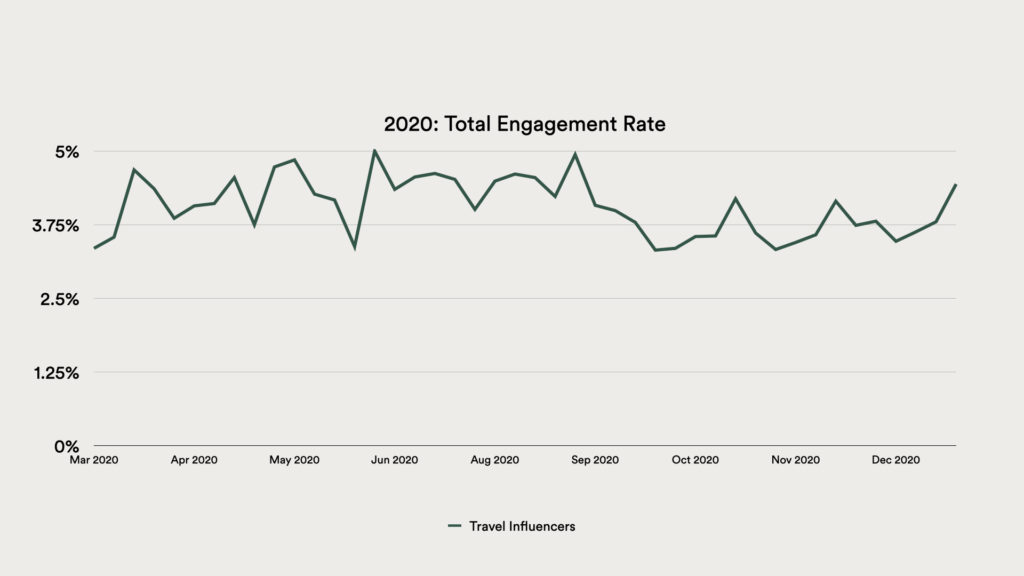
Public CrowdTangle list of 462 travel influencers on Instagram
Engagement, 3/16/19 – 12/20/19 vs. 3/16/20 – 12/20/20
Weekly engagement rate: 4.27% vs. 4.05%, a 5% drop.
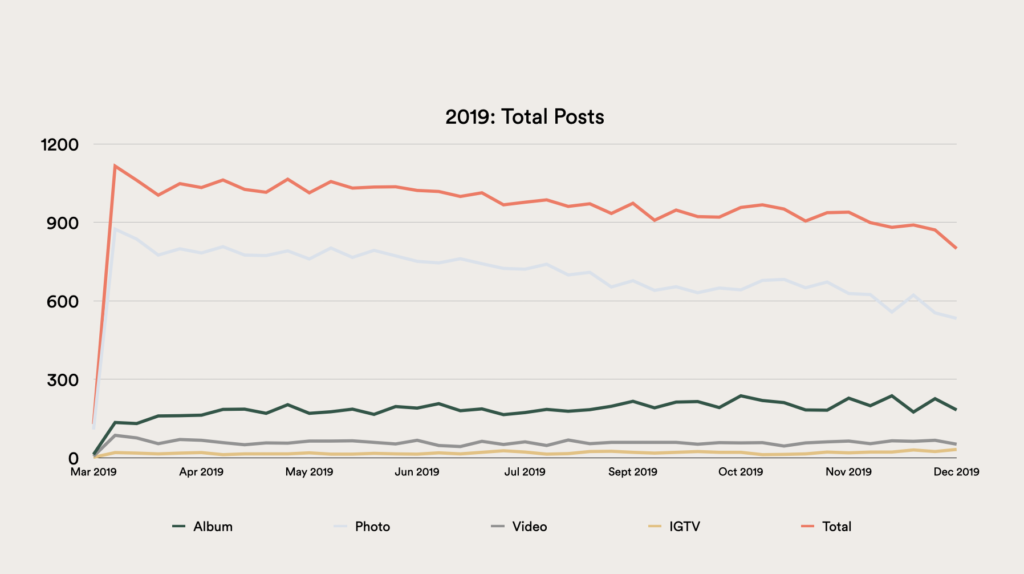
Average weekly post count: 958 vs. 714
—
The Takeaways
While the mostly lowered interaction rates might lead brands to believe the doom and gloom will continue in 2021, we have a sunnier prediction. Extreme social media use is here to stay—those addictive algorithms that kept users glued to their screens throughout the pandemic will only get more sophisticated with all the extra data that was acquired because of the heightened activity. But the new year will likely lack the socio-political events that dominated 2020 feeds and overshadowed brands. That coupled with increased vaccination rates followed by loosened restrictions will allow lifestyle brands and influencers to, well, live again. Everyone might be baking less sourdough bread, but they’ll be flooding back to restaurants around the world, and will want to look good while they dine out.
Your brand will still need to create resonant content on owned pages, but working with influencers your target audience adores will lead to a bigger ROI than the bizarreness of 2020 allowed. Plan your spend accordingly.
